
Overview
To give a real-time summary of the traffic situation in a city is a daunting task. The city may have thousands of roads and intersections. It is unlikely that every road in the city would be checked to know the traffic situation. The smart move would be to check out some of the important roads and intersections across all directions and observe how the traffic’s moving.
If the traffic is all over the place, one would say the traffic’s a hot mess. But if everything seems normal, then it’s all good in the hood. The few important roads and intersections that were monitored to provide an overview of the traffic conditions served as a barometer for the entire city’s traffic situation!
Same is the case in the stock market. One wouldn’t want to go through every single stock listed in the exchanges to figure out whether they are up or down or perhaps flat for the day. That’d be crazy! There are around 3000 listed companies each on the New York Stock Exchange and the Nasdaq.
It would be wiser to check out a few major companies from key industrial sectors. If most of these companies are moving up, then the markets are up. If most of them are down, then the markets are down. And if it’s a mix of both, the markets are sideways or flat for the day.
Basically, a few of the representative companies would be identified to give an idea of how the whole market’s doing. When someone wants to know how the market’s doing, one would check the general trend of the representative companies to know the overall trend of the market. The representative companies collectively make up the stock market index.
The Indexes
It is common for news reporters to mention the Dow going up by 100 points or the S&P going down by five points. However, it can be unclear what these statements mean. The Dow, S&P 500, and Nasdaq Composite are all examples of stock market indices, which are used to measure the performance of groups of stocks. By measuring these stocks together, an index can provide a better understanding of how the market is performing compared to looking at individual stocks.
When considering the performance of the stock market, it is important to keep in mind that focusing too closely on a single aspect can limit one’s understanding of the bigger picture. To gain a more comprehensive understanding of the market, it is beneficial to look at the performance of stock market indices rather than individual stocks. By examining the collective performance of stocks within an index, one can obtain a more extensive view of the market as a whole, resulting in a more complete understanding of its performance.
Dow Jones Industrial Average
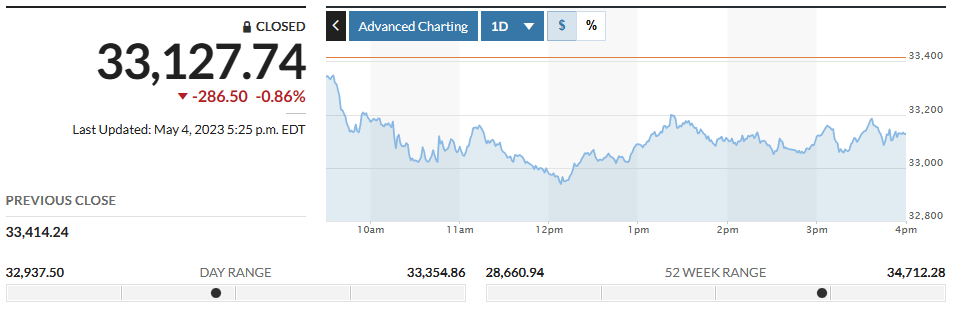
The first stock market index, the Dow Jones Industrial Average, was introduced by financial journalist Charles Dow in 1896. Dow’s method involved adding up the closing prices of 12 leading stocks and then dividing the total by 12 to obtain an average. Currently, the Dow comprises 30 of the most successful and prominent companies in the United States.
A team of specialists selects the companies that make up the Dow to ensure that a diverse range of industries is represented. However, not all of these companies have an equal impact on the index, as many indices employ a form of weighting. To illustrate, consider the concept of grading, where a final exam carries more weight in determining a student’s overall grade than a routine homework assignment. Similarly, in a weighted index, the impact of a company’s performance on the index is proportional to its weighting, which is determined by factors such as its market capitalization.
The Dow index assigns a higher weight to companies with higher stock prices. As an example, in 2018, Boeing, with the highest stock price in the index, accounted for approximately 9% of the index, while Pfizer, with the least expensive stock price, represented only 1% of the index. Consequently, a shift in the price of Boeing would have had a more substantial effect on the Dow than a change in the price of Pfizer.
S&P 500
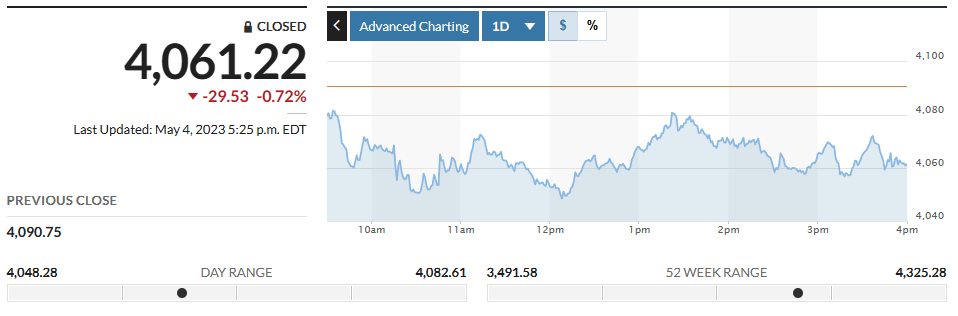
Despite being the most well-established and renowned index, some argue that the Dow’s calculation is not as comprehensive as the S&P 500, even though their performance often mirrors each other. The S&P 500 is an index that tracks the performance of the 500 biggest publicly traded companies in the United States.
Some individuals consider the S&P 500 to be the most comprehensive gauge of the American stock market due to its wider coverage. The S&P 500 is weighted based on the market capitalization of each company. Market capitalization is calculated by multiplying the number of outstanding shares by the price per share. Consequently, companies with the highest total market value have a more substantial influence on the S&P 500 average.
Nasdaq Composite
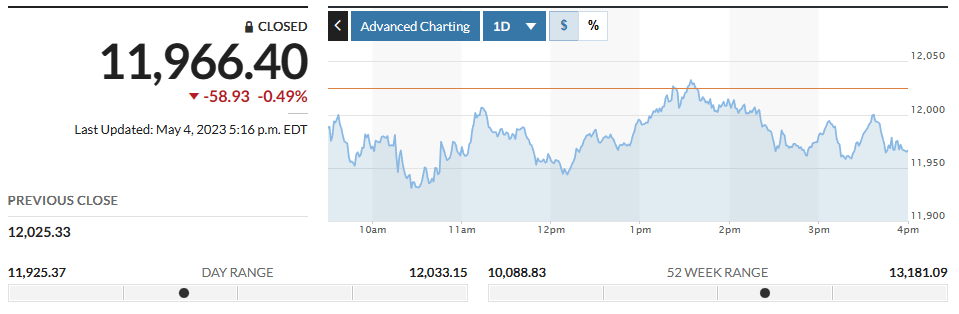
The Nasdaq Composite, which is also referred to as the Nasdaq, is an index that monitors approximately 3,000 businesses that are registered on the Nasdaq exchange. The Nasdaq covers more smaller businesses than the other indices, but it also comprises many of the most prominent tech companies such as Apple, Amazon, Microsoft, and Alphabet. Since almost half of the firms in the index belong to the technology sector, the Nasdaq is frequently regarded as a superior barometer for the tech industry. Some of these businesses may also be included in the Dow, the S&P 500, or both.
Every index assists in measuring the market’s overall performance via the securities it monitors. While the market may fluctuate daily or even yearly, the historical records of indices demonstrate that the stock market has a tendency to increase over time.
Practical uses of the Index
Information

The index reflects the overall sentiment and trend in the market. The index broadly represents the country’s state of the economy. A stock market index that is up indicates people are optimistic about the future. Likewise, people are pessimistic about the future when the stock market index is down.
The time frame for calculating the index can be any. A specific example is the Nasdaq index, which dropped from 11533 to 11372 in just an hour on 13th December 2022. Such a rapid fall within a short span of time indicates that the market participants are not feeling enthusiastic about the market’s short-term prospects.
Benchmarking

Benchmarking is a crucial aspect of evaluating trading and investment activities. It provides a yardstick to measure performance and ascertain whether the returns generated are adequate in relation to broader market trends.
Suppose an investor generates a return of $ 20,000 on an investment of $ 100,000 over the course of one year, resulting in a total corpus of $120,000. While a 20% return may seem impressive, it is important to consider how this performance compares to the broader market. If the S&P 500 has moved to 30% during the same period, the investor’s returns may seem less in comparison to market trends.
Investors often aim to achieve returns that outpace the market benchmark, and thus it can be disheartening to realize that their investment performance falls short. The market index serves as a valuable yardstick for assessing one’s investment performance. Without an index to provide context, it can be difficult to accurately gauge how one’s investment portfolio has performed in relation to the broader market. As such, investors rely on market indices to serve as a benchmark against which they can measure their own performance.
Trading

Index trading is a widely popular practice in the financial market, with a majority of traders using it as a tool for their trades. This method involves taking a broader view of the economy or the overall state of affairs and using that information to make a trade. Typically, traders make a short-term prediction on the index to execute their trades.
For example, imagine this scenario. At 10:30 AM, the Secretary of the Treasury is expected to deliver a speech on the state of the economy. An hour before the announcement, the S&P 500 index is at 4,200 points. Anticipating a favorable speech for the nation’s economy, the index is expected to move up. To act on the prediction, one may want to buy the index at 4,200, as it represents the broader economy of the United States.
If your prediction is correct and the Secretary of the Treasury delivers a favorable speech on the state of the economy, the S&P 500 index could move up from its current level of 4,200 points. Assuming the index does move up to 4,450 points, you can book a profit of 250 points by exiting the trade. This type of trade is possible through the use of derivatives, a segment of the markets that allows investors to take positions on the index’s movements.
Portfolio Hedging

Portfolio hedging is a common practice among investors who typically hold a portfolio of 15-20 stocks for the long term. Although these stocks are held with a long-term perspective, there may be situations where prolonged adverse market movements, such as those experienced in 2008, could potentially erode the capital in the portfolio. In such cases, investors can use the index to hedge the portfolio. The topic of portfolio hedging through the use of futures trading will be explored in greater detail in a dedicated module.
Index construction methodology
Understanding the construction of the index is important, particularly for individuals seeking to progress as index traders. As previously explained, the index comprises numerous stocks from various sectors that reflect the condition of the economy. To be included in the index, a stock must meet specific requirements. Additionally, if a stock is approved as an index stock, it must continue to satisfy the designated criteria. Failure to meet the criteria results in the replacement of the stock with another that meets the prerequisites.
The list of stocks is populated based on the selection procedure. Each stock included in the index must be assigned a specific weightage. In essence, weightage determines the level of significance assigned to a particular stock in comparison to the others in the index.
An important question arises – how are weights assigned to the stocks that comprise the Index? The US stock exchange utilizes a free-float market capitalization method to assign weights, though there are numerous ways to do so. The company’s free-float market capitalization is used as a basis for weight assignment, with greater market capitalization resulting in higher weightage.
Free float market capitalization is the product of the total number of shares outstanding in the market and the stock price.
For example, company ABC has 100 shares outstanding in the market, and the stock price is at 50, then the free-float market cap of ABC is 100*50 = $5,000.
At the time of writing this chapter, the following are the top 10 index heavyweight of Dow Jones –
| Ranking | Company | Market Cap (USD) | Sector | Industry |
| 1 | Apple Inc. | $2.067 T | Technology | Consumer Electronics |
| 2 | Microsoft Corporation | $1.788 T | Technology | Software Infrastructure |
| 3 | UnitedHealth Group Incorporated | $495.37 B | Healthcare | Healthcare Plans |
| 4 | Johnson & Johnson | $461.85 B | Healthcare | Drug Manufacturers |
| 5 | Visa Inc. | $439.96 B | Financials | Credit Services |
| 6 | JPMorgan Chase & Co. | $393.34 B | Financials | Banks |
| 7 | Walmart Inc. | $382.38 B | Consumer Staples | Discount Stores |
| 8 | The Procter & Gamble Company | $359.15 B | Consumer Staples | Household & Personal Products |
| 9 | Chevron Corporation | $336.43 B | Energy | Oil & Gas Integrated |
| 10 | The Home Depot, Inc. | $321.97 B | Consumer Discretionary | Home Improvement Retail |
Sector-specific indices
While the Dow Jones, S&P 500 and Nasdaq Composite represent the broader markets, certain indices represent specific sectors. These are called sectoral indices. Both the New York Stock Exchange and Nasdaq have sector-specific indices. The construction and maintenance of these indices are similar to the other major indices. Some of the sector specific indices are Dow Jones U.S. Banks Index, Dow Jones U.S. Real Estate Index, Nasdaq US Smart Oil & Gas Index, Nasdaq Biotechnology Index, S&P 500 Real Estate and S&P 500 Energy.
Key Takeaways
- An index serves as a measure of the overall economy’s health.
- When an index goes up, it signals that investors are feeling positive about the market.
- Conversely, when an index goes down, it suggests that investors are feeling negative about the market.
- In the US, the three primary indices are the Dow Jones Industrial Average, S&P 500 and Nasdaq Composite.
- Indices can be used for a variety of purposes, including obtaining information, measuring performance against a benchmark, trading, and hedging.
- Trading based on indices is the most popular way of using them.
- There are sector-specific indices that provide insight into the mood of particular sectors.